
Amrudin Ćatić
Strategy, creativity, and technology are combined to craft digital experiences that perform. Smart marketing meets creative execution, always focused on growth, problem-solving, and real impact.
Tag Archives: strategy
Marketing is full of dead ideas nobody has the guts to bury
Marketing today isn’t an industry, it’s a cemetery.A field of decaying ideas that everyone keeps pretending are still alive. People walk around acting like the smell isn’t real, like the corpse in the middle of the room is just “going through a phase.” Here’s the truth: half the strategies brands still use don’t work. The…
The psychology behind the CHATA model: Why it works in real decision-making
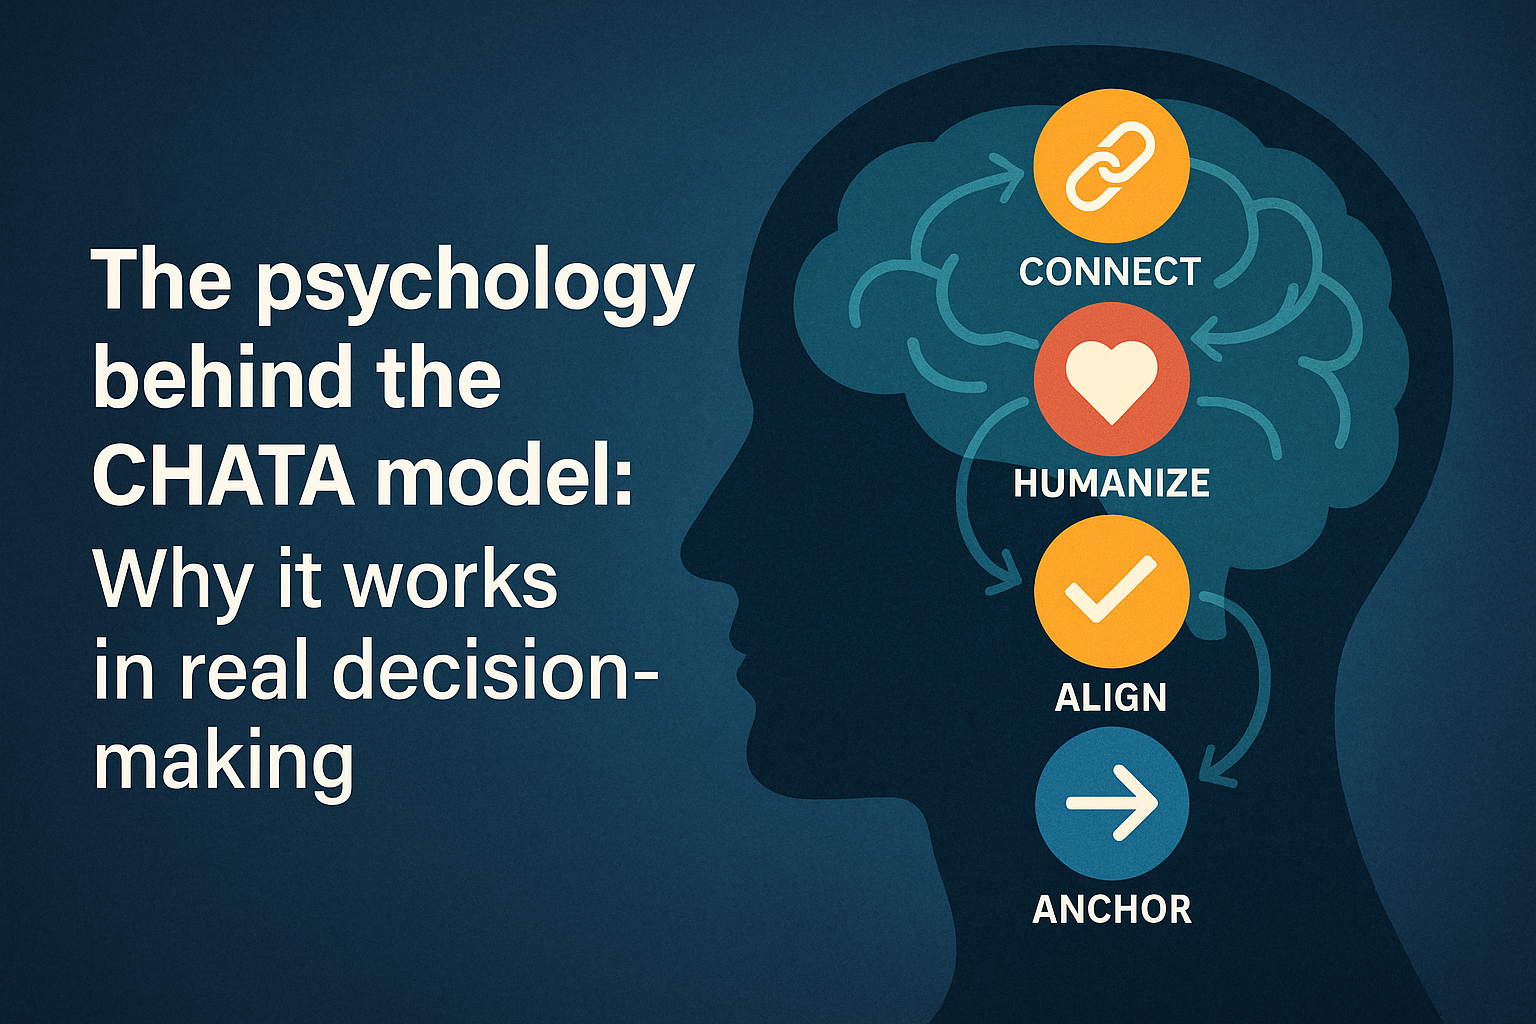
Marketing frameworks fail when they simplify human behaviour into linear formulas. Humans don’t think in steps. They don’t follow funnels. Instead, people navigate decisions based on context, identity, uncertainty, cognitive load, trust cues, relevance, and emotional resonance. CHATA model is based on psychology and built around these realities, not outdated sales logic. This is why…
The most dangerous word in business: “Maybe.”
“Maybe” doesn’t explode.It doesn’t collapse.It doesn’t make headlines.It doesn’t even announce itself. It just sits there, quiet, polite, disguised as caution, while it drains momentum from ideas that once had fire, teams that once had ambition, and projects that once had a pulse. “Maybe” is the corporate version of shrugging your shoulders and hoping the…
Applying CHATA model to landing pages: Turning scanners into buyers
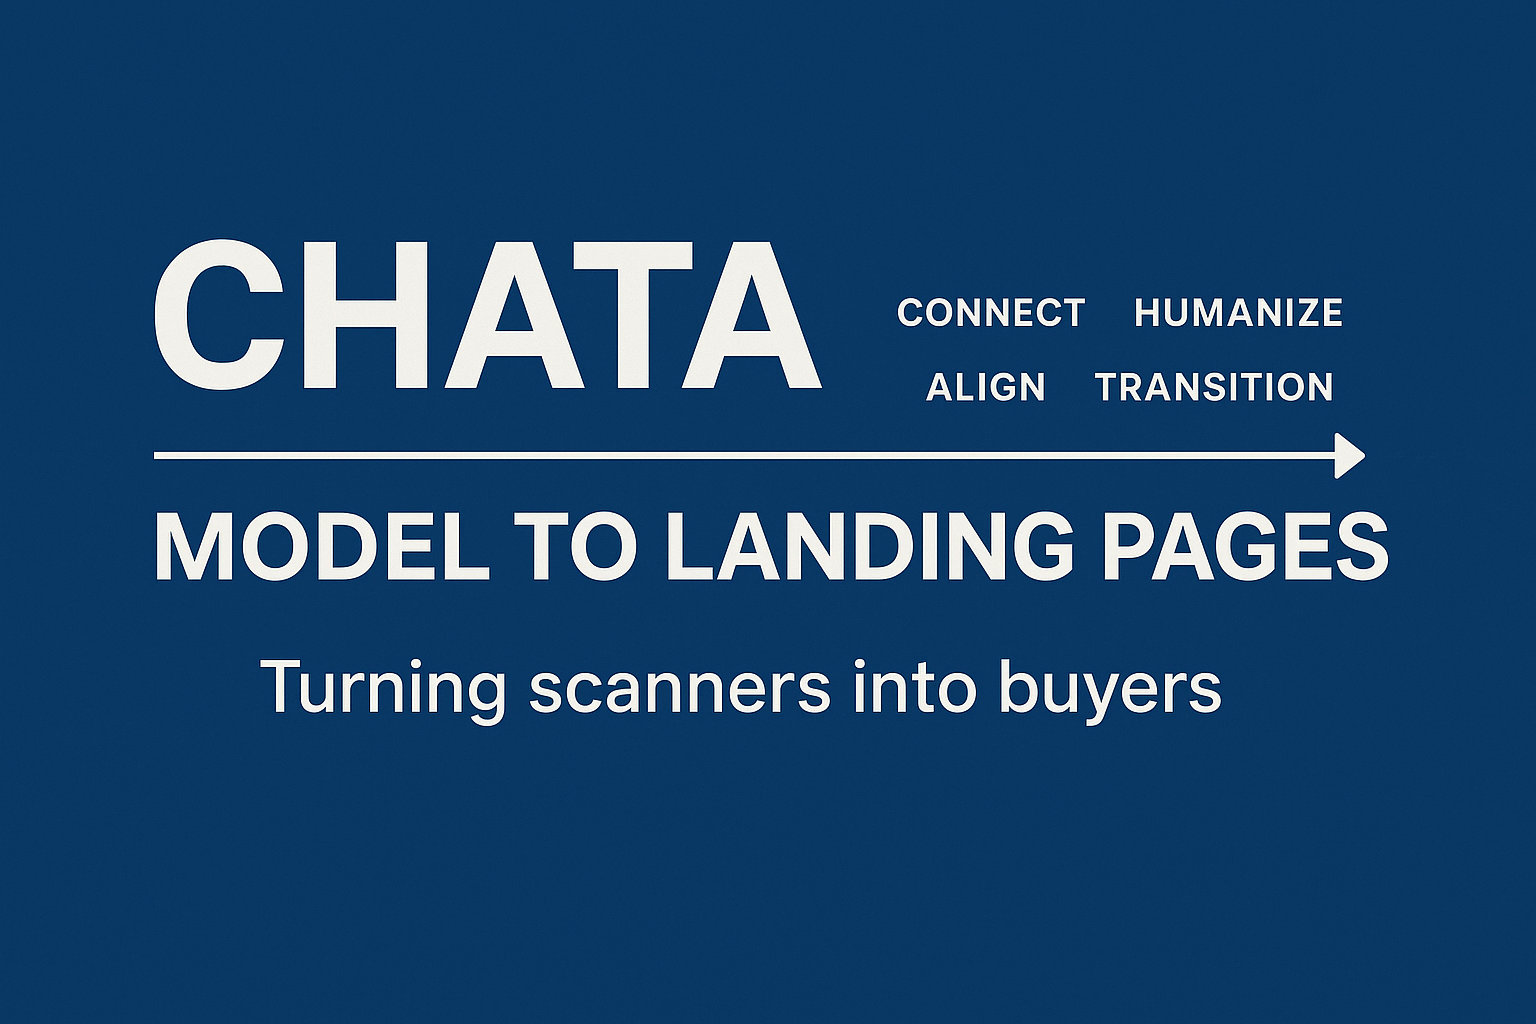
This article breaks down how to apply the CHATA model to landing pages so scanners turn into readers, and readers turn into buyers. Most landing pages don’t fail because of design, traffic quality, or tools.They fail because the message breaks at the exact moment the user is trying to make sense of what the page…
SEO vs Google Ads in 2025 recap

This guide delivers a full SEO vs Google Ads in 2025 recap, covering performance, costs, trends, and strategies to help businesses choose the right approach. In the fast-changing world of digital marketing, comparing SEO vs Google Ads in 2025 has become more important than ever. With Google integrating AI deeply into its search ecosystem and user behavior evolving…
SEO Core Web Vitals in 2026: What’s changed and what still matters?
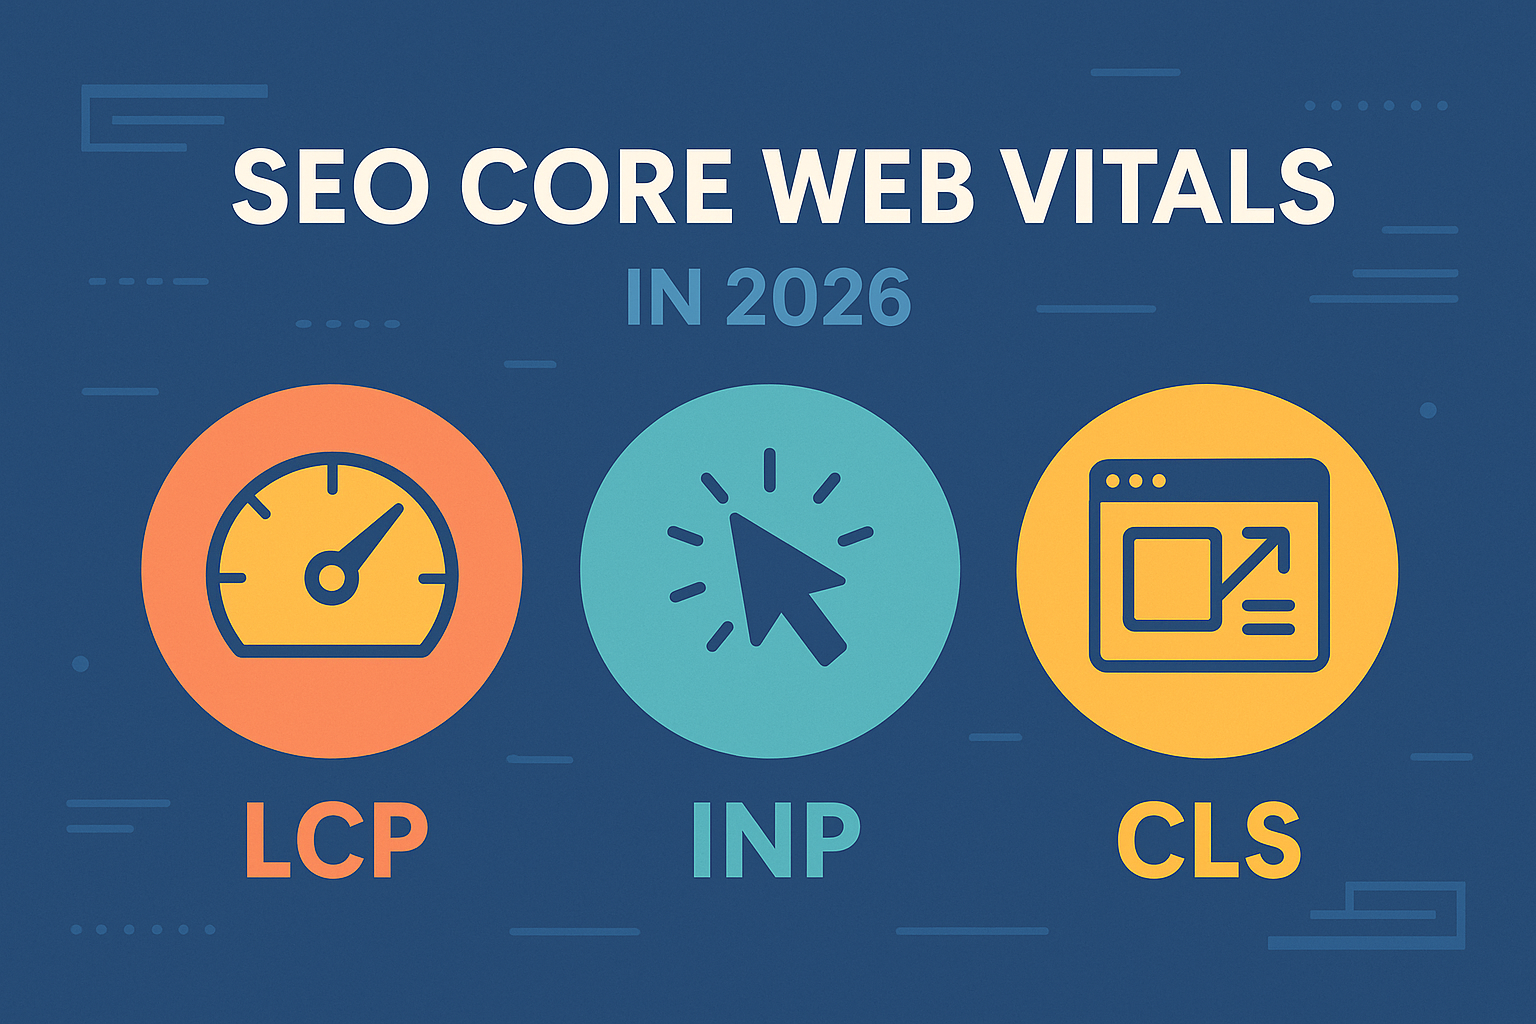
SEO continues to evolve at lightning speed, and SEO Core Web Vitals in 2026: What’s changed and what still matters? is one of the most important topics for site owners, developers, and digital marketers. As Google sharpens its focus on real user experience, Core Web Vitals have gone from “nice to have” to non-negotiable ranking factors. This guide…
CHATA model for SEO: Aligning with SGE, entities & topical authority
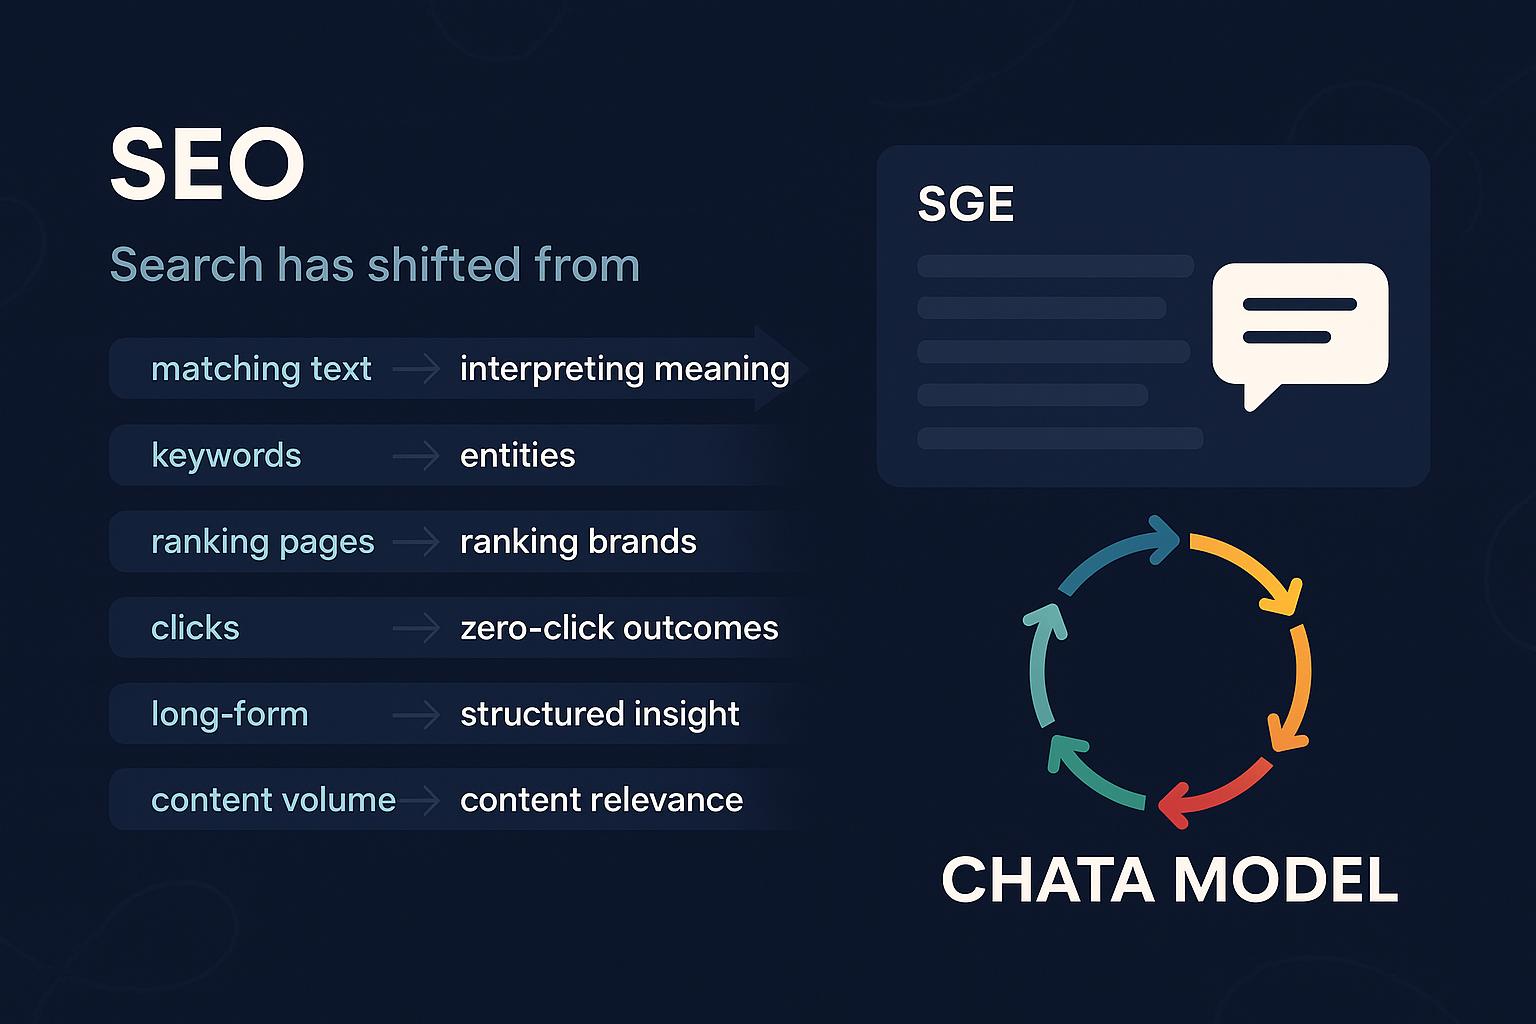
SEO is no longer keyword-driven, linear, or static. It’s shaped by Search Generative Experience (SGE), entity-based understanding, AI summarisation layers, topical authority, and user behaviour that moves in loops instead of funnels. Most SEO frameworks still focus on traditional mechanics: keyword research, on-page structure, link building, and technical health. These still matter, but they no…
PBNs, parasite SEO, and other grey hat tactics: Still alive in 2026?
PBNs, parasite SEO, and other grey hat tactics: Still alive in 2026? Learn how these controversial strategies work today, how effective they are, and whether they’re still worth the risk. Grey hat SEO has always walked the thin, blurry line between what’s allowed and what quietly breaks the rules. As we head deeper into 2026,…
12 powerful white hat link building strategies that work in 2026

White hat link building strategies that actually work in 2026 are evolving fast. Learn the safest, most effective, Google-approved ways to build authority and boost rankings. Understanding White Hat Link Building in 2026 Search engines evolve every year, but 2026 brought one of the biggest updates yet. Google’s new real-time spam filters now read context,…
CHATA vs AIDA: Why modern marketers need a more adaptive model
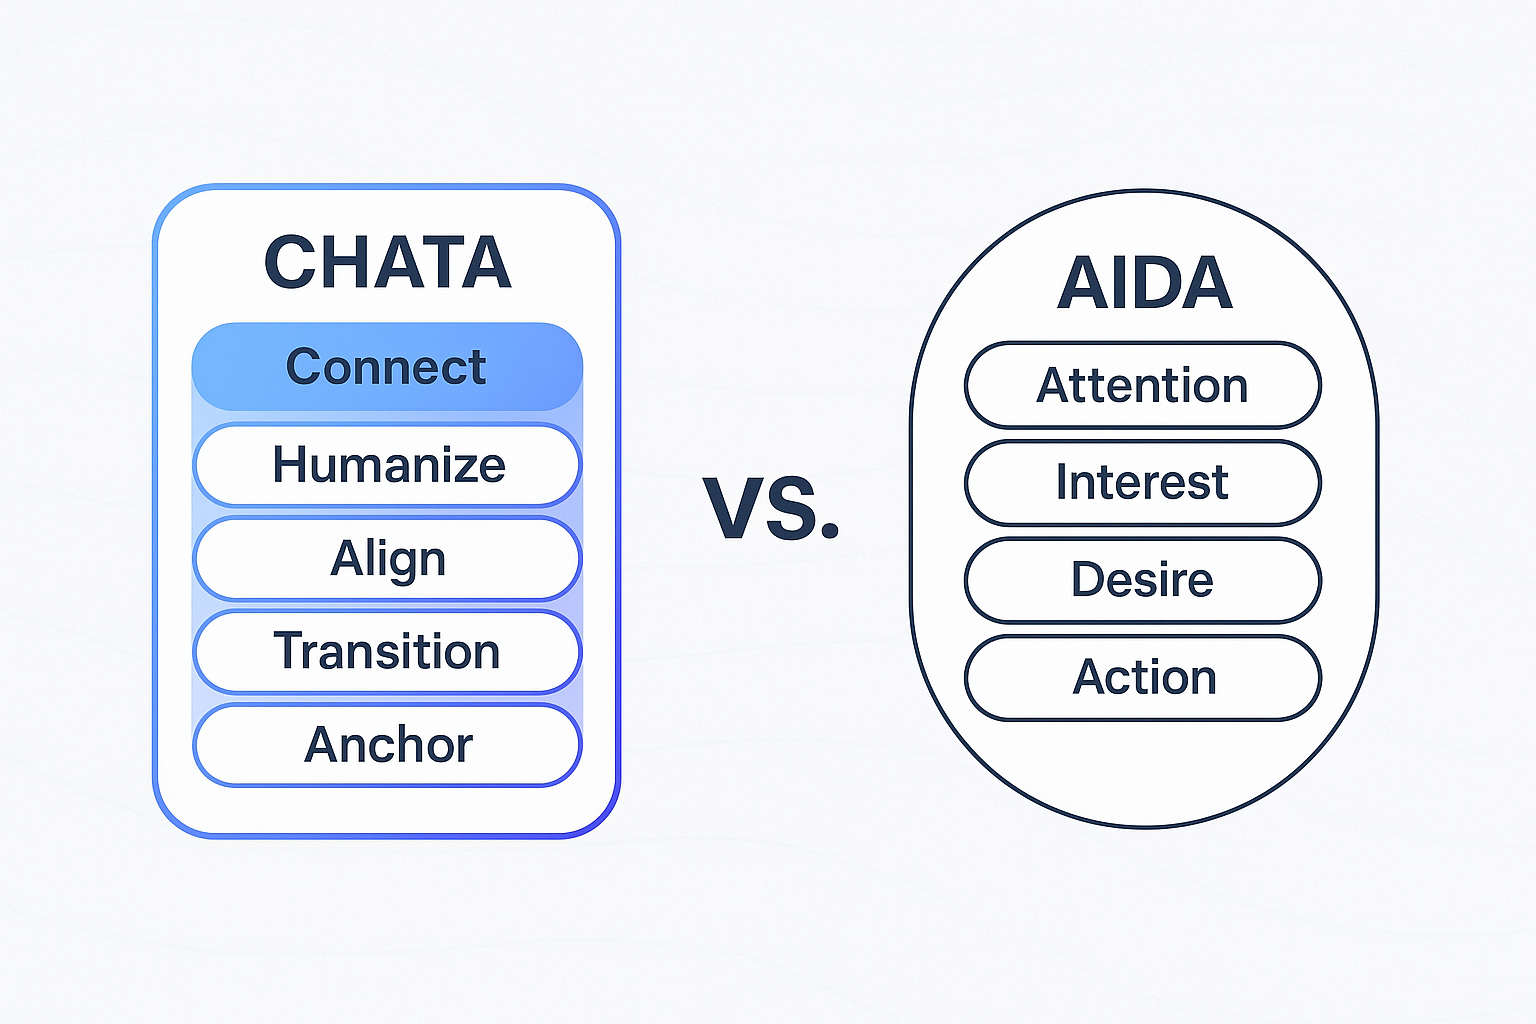
This article breaks down the real differences, the limitations of AIDA, and why CHATA is a more adaptive model for today’s marketing landscape. For decades, AIDA (Attention → Interest → Desire → Action) has shaped the way marketers write, persuade, and build communication.It became a universal template, simple, memorable, and easy to teach. But simplicity…